Part A: The Pillar of Smoke
Note: After reading this, check out Part B: The Swirly Gases for more details.
This guide outlines the mathematical model and setup for creating a mushroom cloud.
A mushroom cloud can be broken down into two main parts:
- The pillar of smoke, which we'll call "Part A".
- The swirling gases, which we'll call "Part B".
We'll first focus on Part A, and later combine it with Part B for the complete effect.
Exponential Wizardry
The "pillar" of the mushroom cloud must achieve two things: it must curve upwards and rise. This curve can be modeled with the function:
3^(2x - 3)
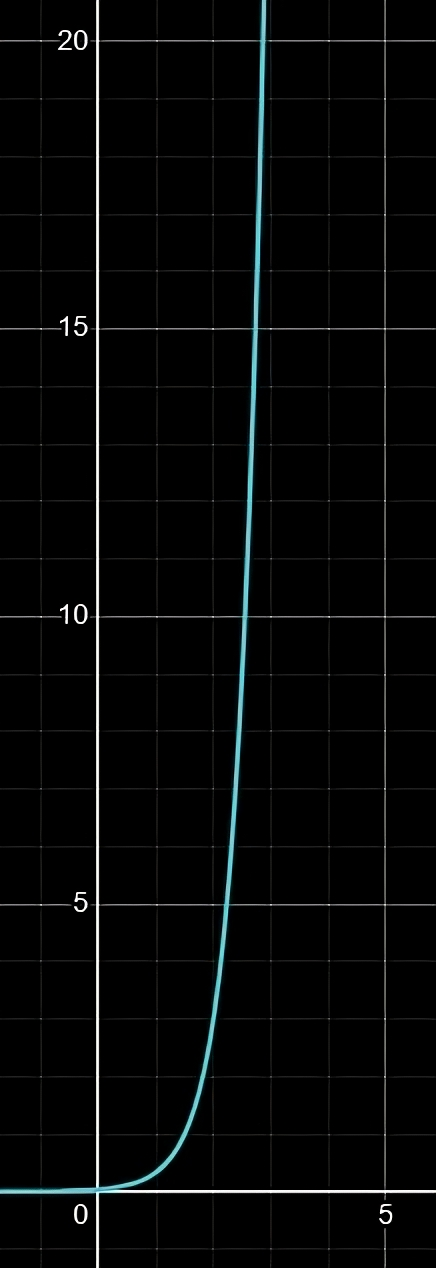
This graph represents the function. As shown, the smoke particles start with a smooth curve, then eventually rise almost vertically.
To simulate this, we need a variable that updates the value of x over time. This variable is called tickCounter, and it increments with each tick.
We can use this value as the input to our function, which will give us the height of the particle at any given time. Here's an example:
private int tickCounter;
This variable can be used as the 'x' value in the above function. I recommend adjusting the function and elapsedTicks to make the particle speed look smooth and consistent. Here's how I implemented it:
public void partA() {
    double timeInSeconds = (double) tickCounter / 20;
    double particleHeight = Math.pow(3, 2 * timeInSeconds - 3);
    double previousParticleHeight = Math.pow(3, 2 * timeInSeconds - 3 - 0.1);

    float rStart = 115, rEnd = 255;
    float gStart = 115, gEnd = 75;
    float bStart = 115, bEnd = 0;
    float progress = (float) tickCounter / VARIANT1_RESET_TICK;
    this.rCol = Math2.interpolateColor(rStart,rEnd,progress);
    this.gCol = Math2.interpolateColor(gStart,gEnd,progress);
    this.bCol = Math2.interpolateColor(bStart,bEnd,progress);

    double deltaX = 1.0 / 20.0;
    double deltaY = particleHeight - previousParticleHeight;
    double magnitude = Math.sqrt(deltaX * deltaX + deltaY * deltaY);
    deltaX = (deltaX / magnitude) * 0.5;
    deltaY = (deltaY / magnitude) * 0.5;

    localY += deltaY;
    localZ -= deltaX;
    double relativeX = localX - originX;
    double relativeY = localY - originY;
    double relativeZ = localZ - originZ;

    Vector2D rotatedXZ = Math2.rotateCoordinate2D(relativeX, relativeZ, rotationAngle).offset(offsetX, offsetZ).offset(originX, originZ);
    this.setPos(rotatedXZ.x, originY + relativeY, rotatedXZ.y);
}
Explanation:
In this implementation, we first convert elapsedTicks into seconds (since there are 20 ticks per second), and then plug that value into the formula to determine the particle's height at that point in time.
As elapsedTicks increases, it gives us a smooth transition for the particle’s movement along the curve.
One challenge with this approach is that the particle's movement speed increases as the graph's slope becomes steeper. To address this, we calculate the change in the x and y values (deltaX and deltaY), and normalize them by dividing by the magnitude of the change. The magnitude is the square root of the sum of the squares of the x and y changes. This ensures the particle moves smoothly regardless of the steepness of the curve.
Color Transition
As the smoke particle rises from the bottom of the pillar to the top, it should transition from gray to orange. To achieve this, we use linear interpolation.
The formula for linear interpolation is:
y = y0 + ((x - x0) / (x1 - x0)) * (y1 - y0)
This takes a start value (x0, y0) and an end value (x1, y1), and allows us to determine any value in between.
By applying this to the red, green, and blue color channels, we can smoothly transition the particle color from gray to orange as it rises.